Scores the pipeline. Flags the risk. Recommends what’s next.
Tracking LP pipeline health usually means pulling stage data into a spreadsheet by hand, then guessing which relationships are stalling before it’s too late.
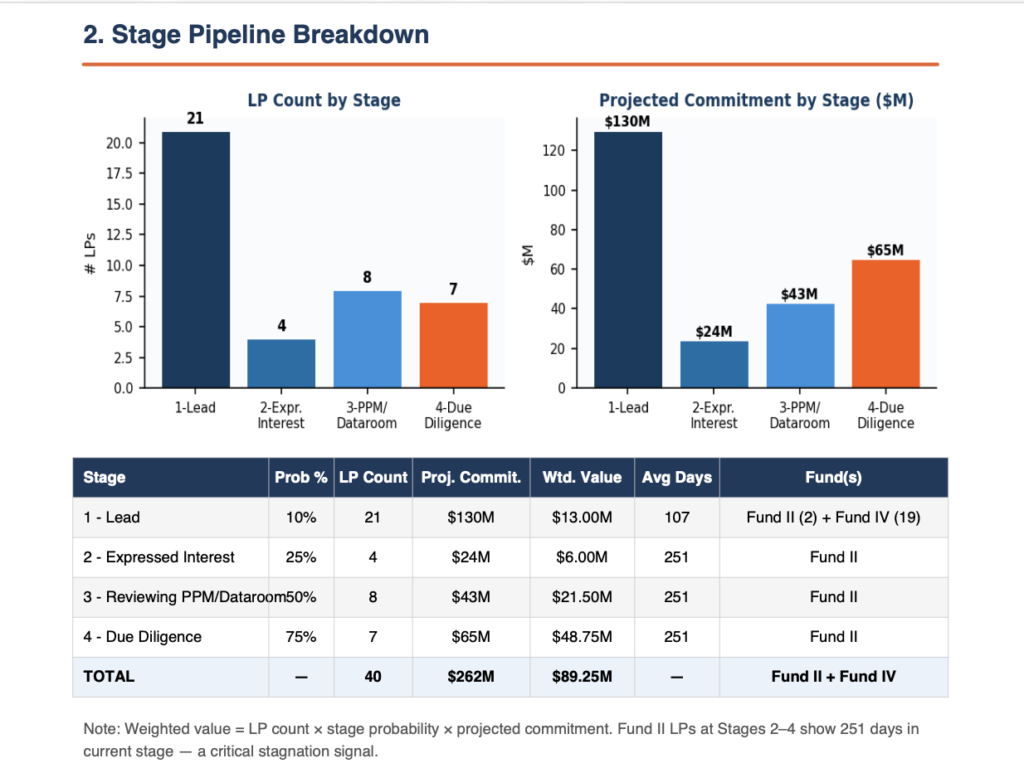
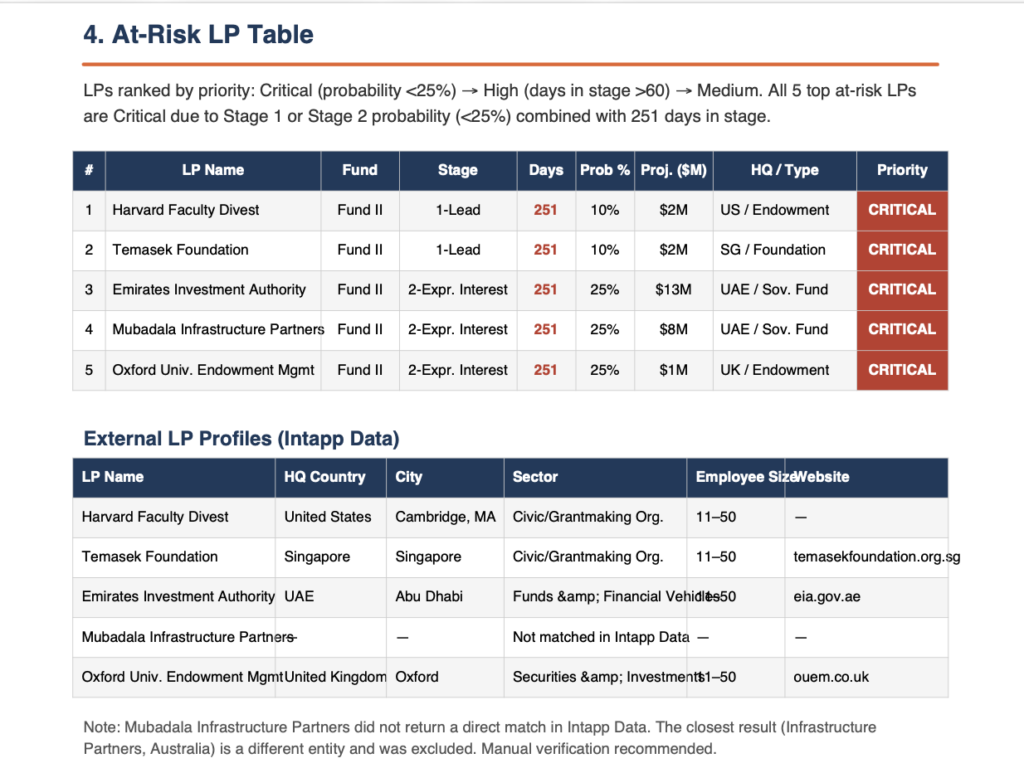
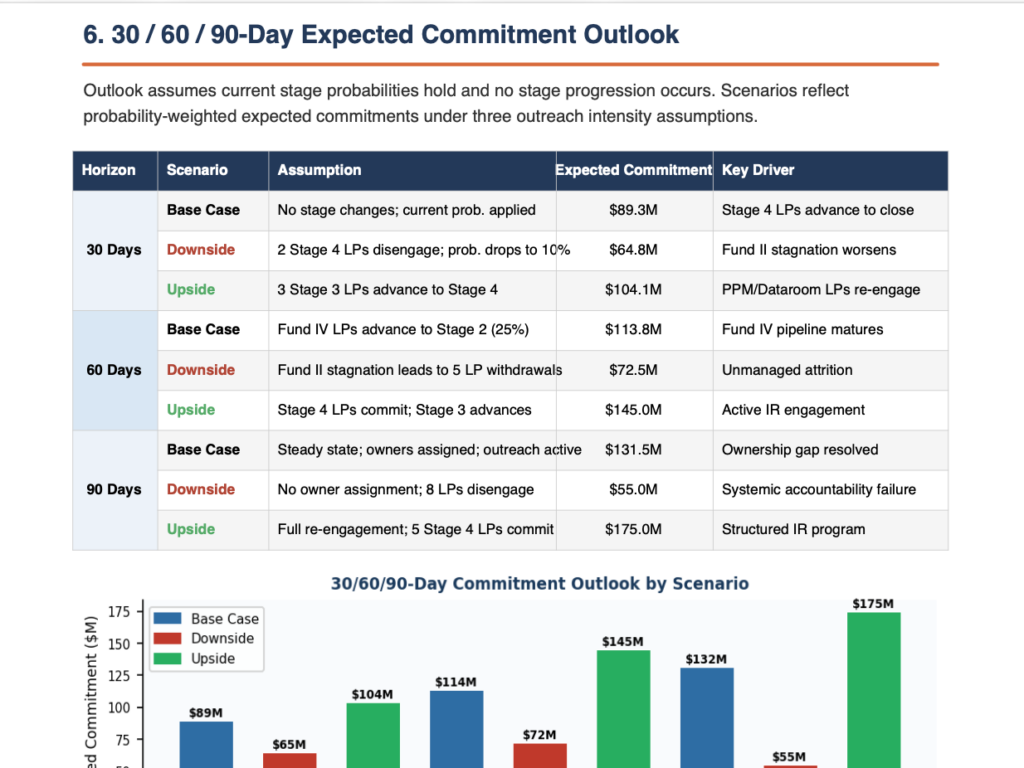
Celeste breaks down your active LP pipeline by stage, commitment probability, and outreach velocity, then flags the LPs most at risk of falling through. It delivers a structured report with bottleneck analysis, a 30/60/90-day outlook, and recommended next actions for your top priorities.
You get a clear action list, not another spreadsheet to interpret.