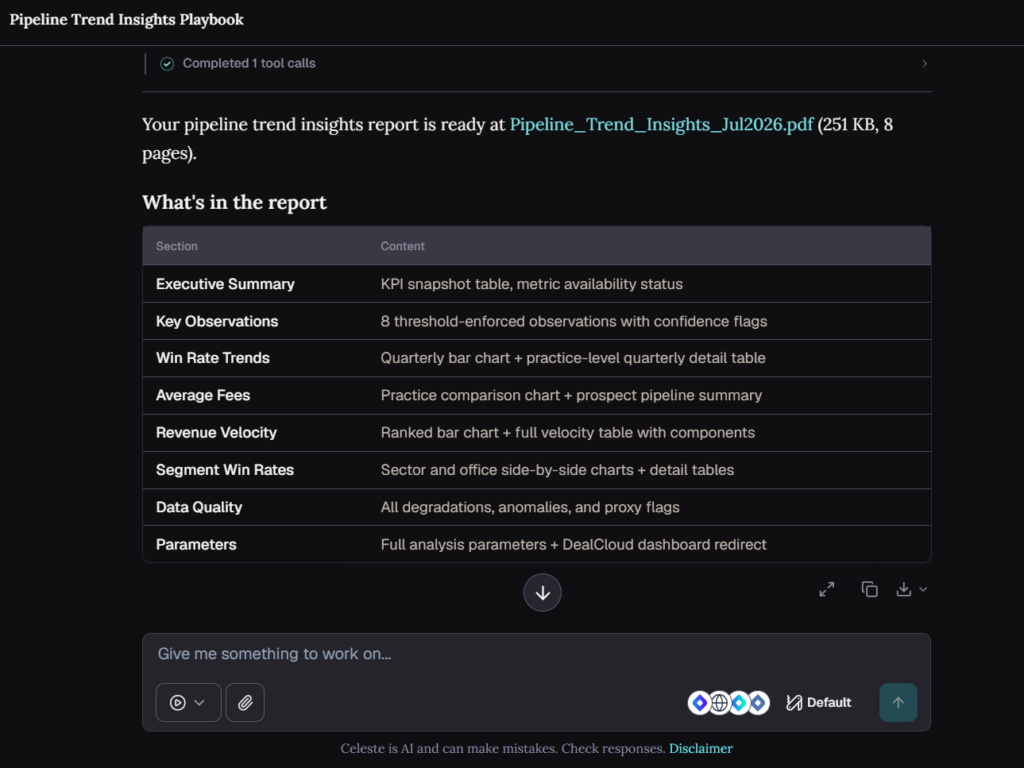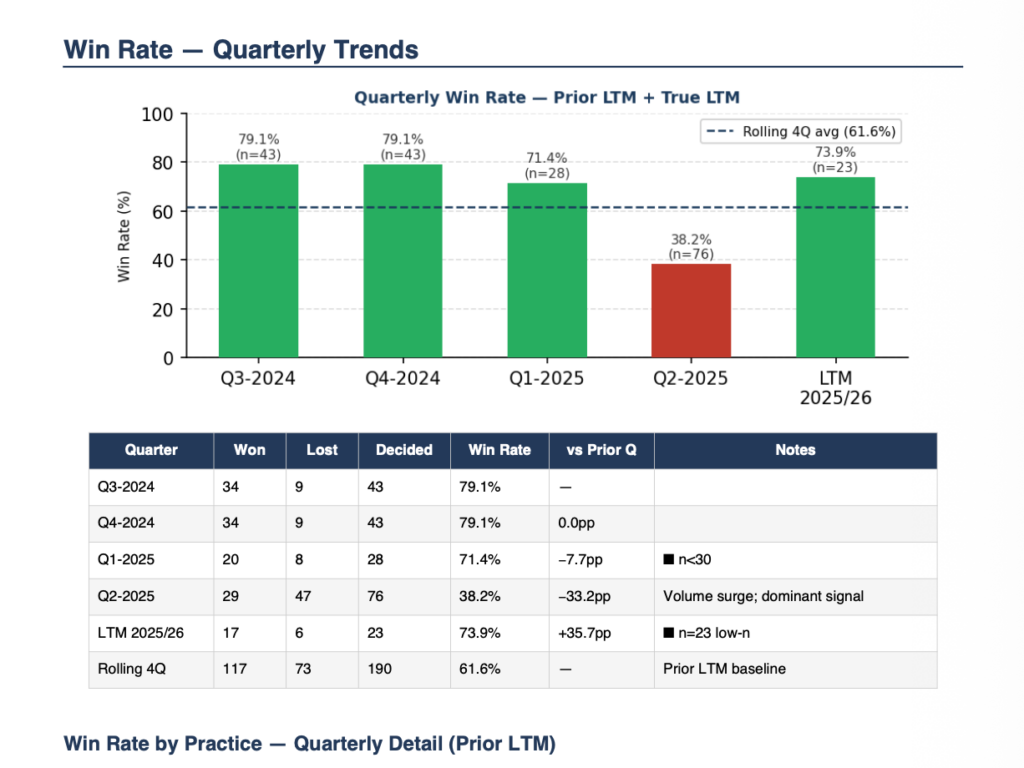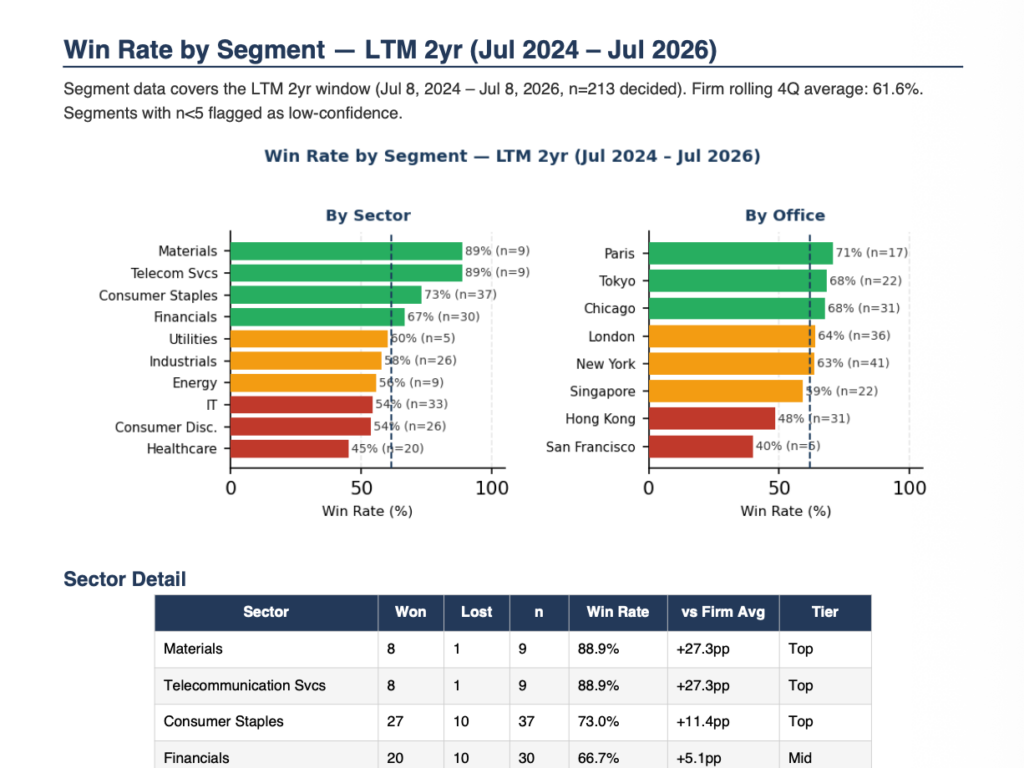
Tracks the trend. Flags the pattern. Explains what changed.
Most pipeline dashboards show you where things stand today, but spotting whether performance is actually improving or sliding over time usually means building a custom analysis by hand.
Celeste tracks seven pipeline metrics over time and breaks them down by practice, sector, and office — then surfaces the patterns that matter most as plain-language observations. It’s built to complement your existing dashboards, not replace them.
You get the trend behind the numbers, not just the numbers.